Inspiration
As daily users of railway services in Catalonia, we have experienced a real problem that affects a large number of people, but especially us, the students. For this reason, we believe that knowing in advance the internet connectivity limitations we will experience during the journey would be very useful.
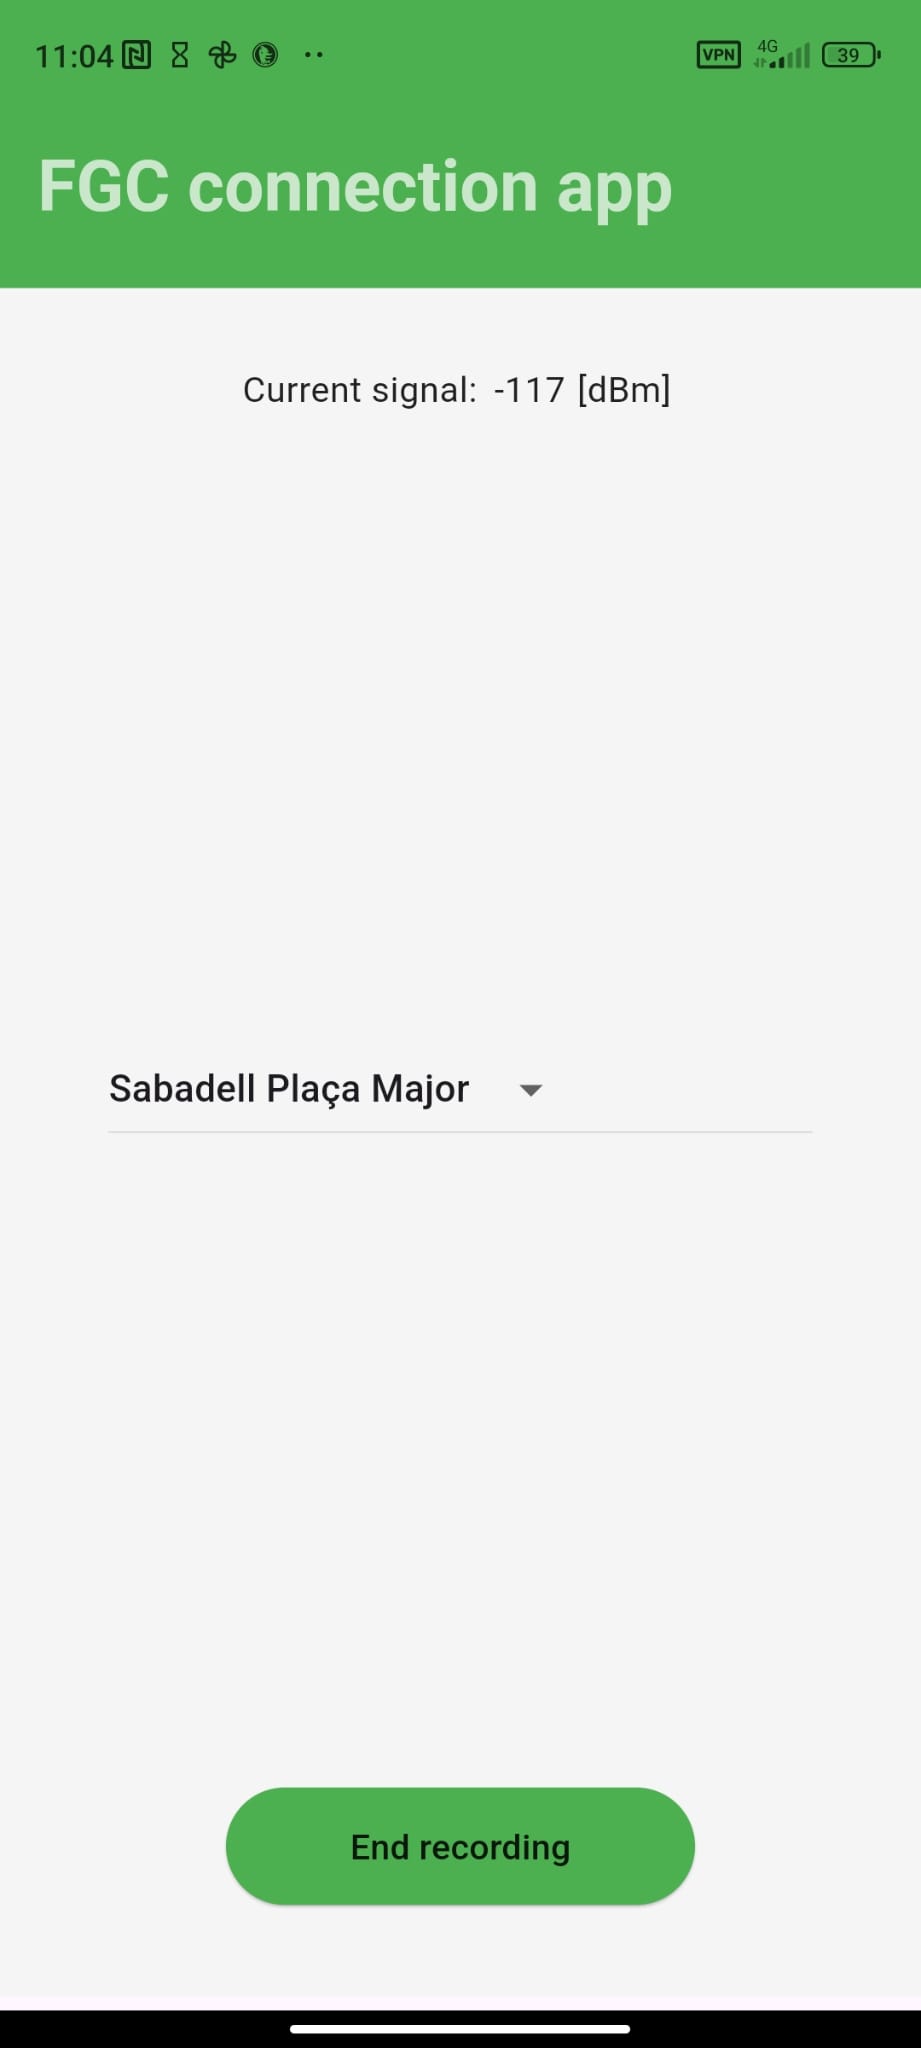
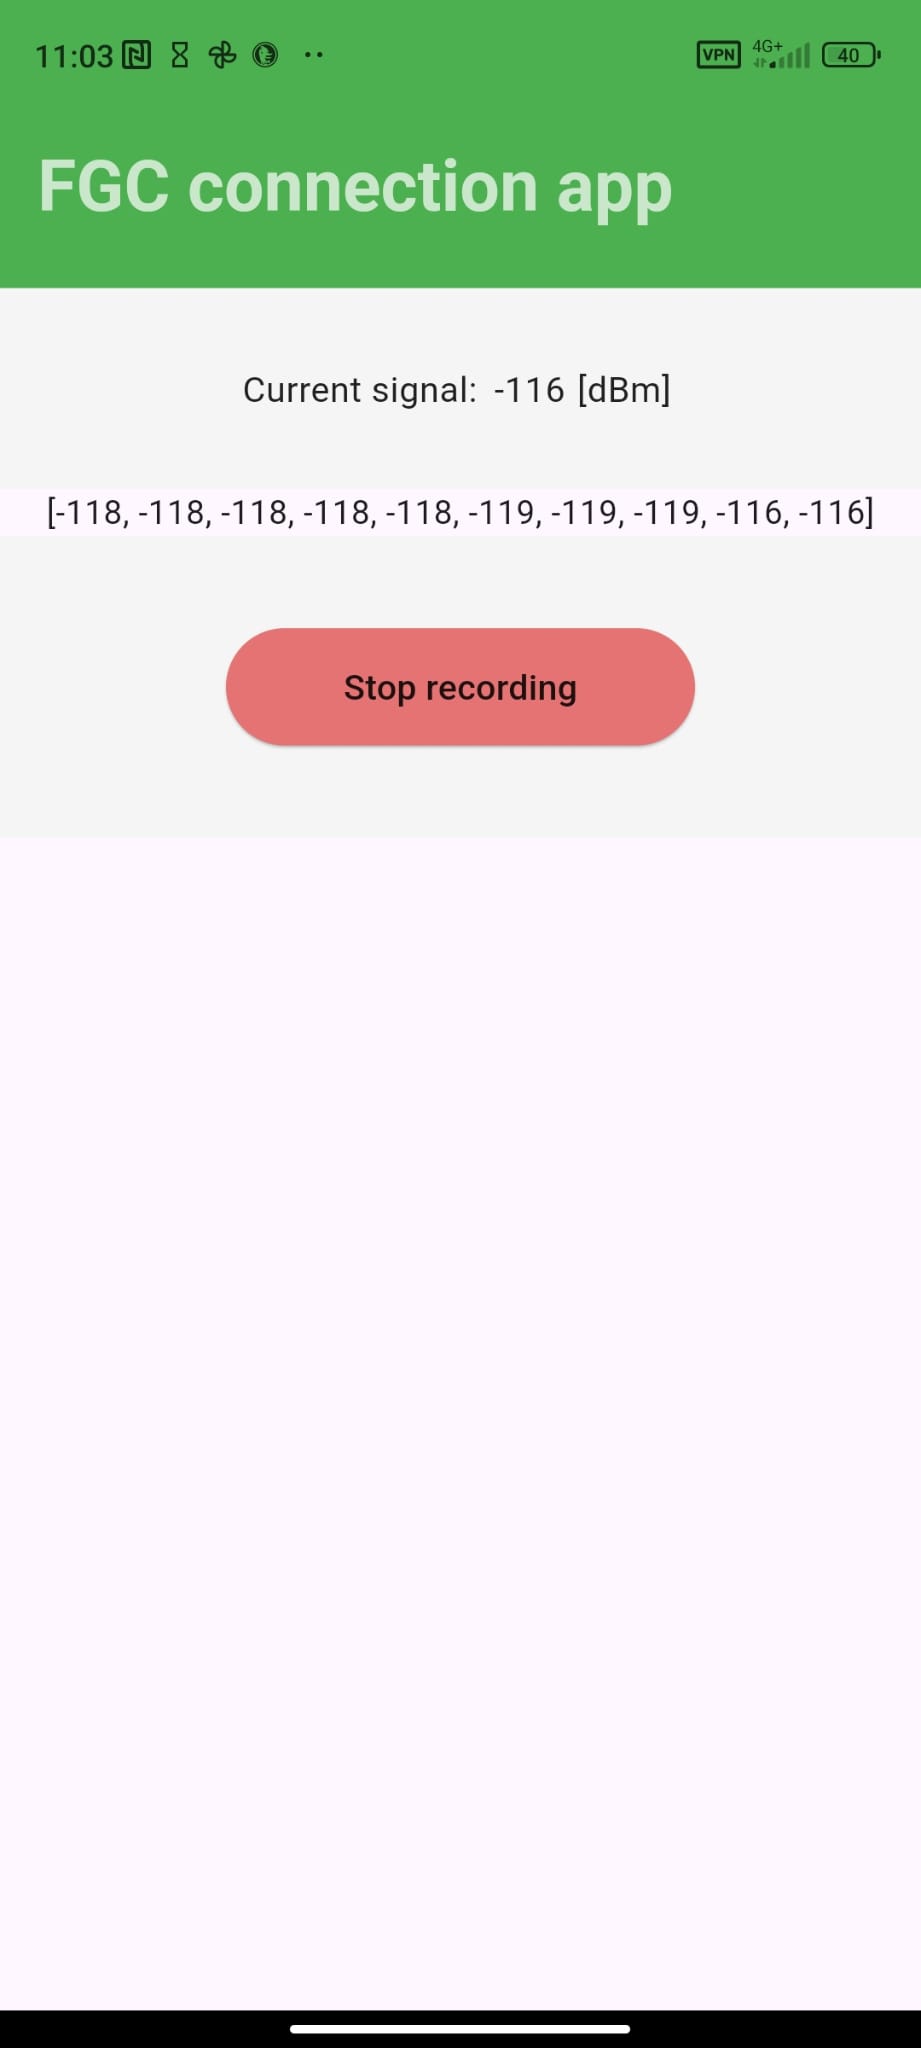
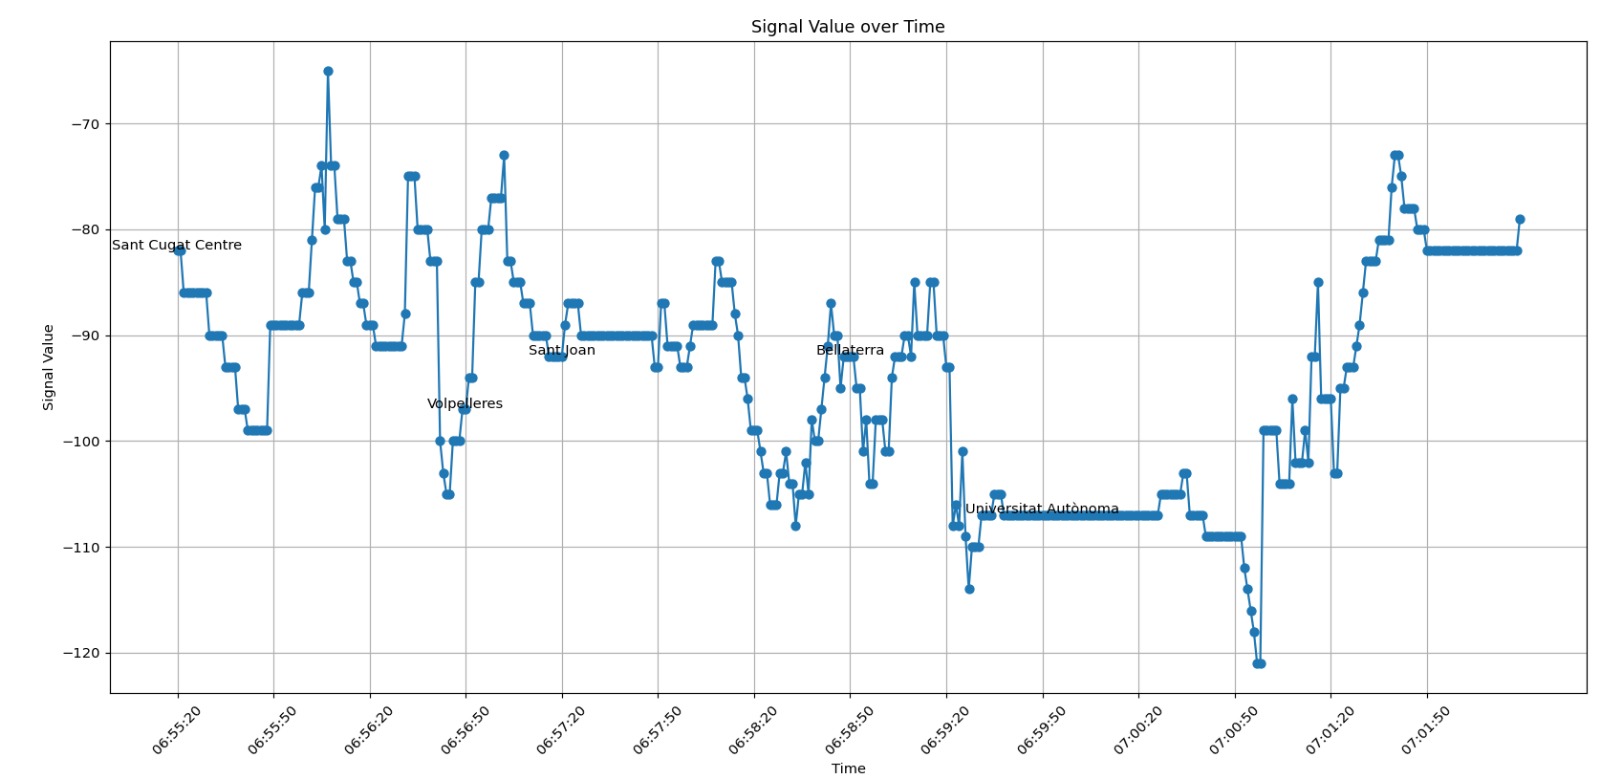
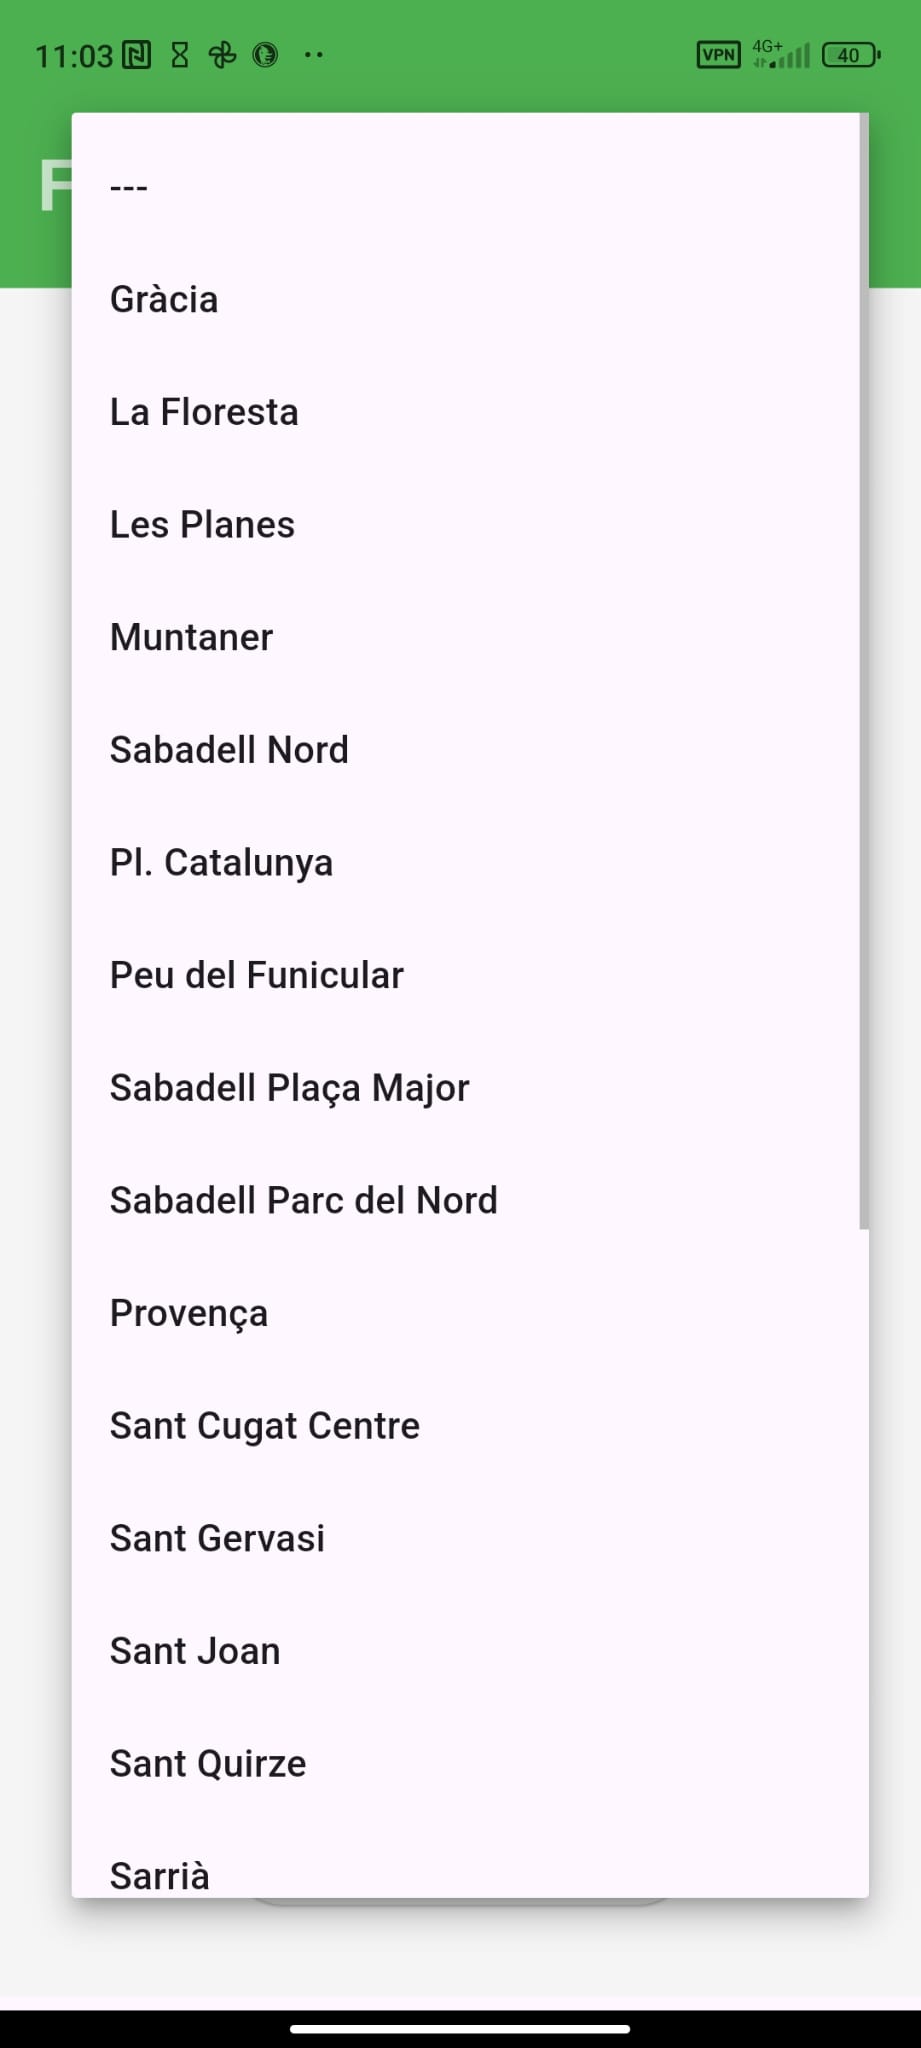
What it does
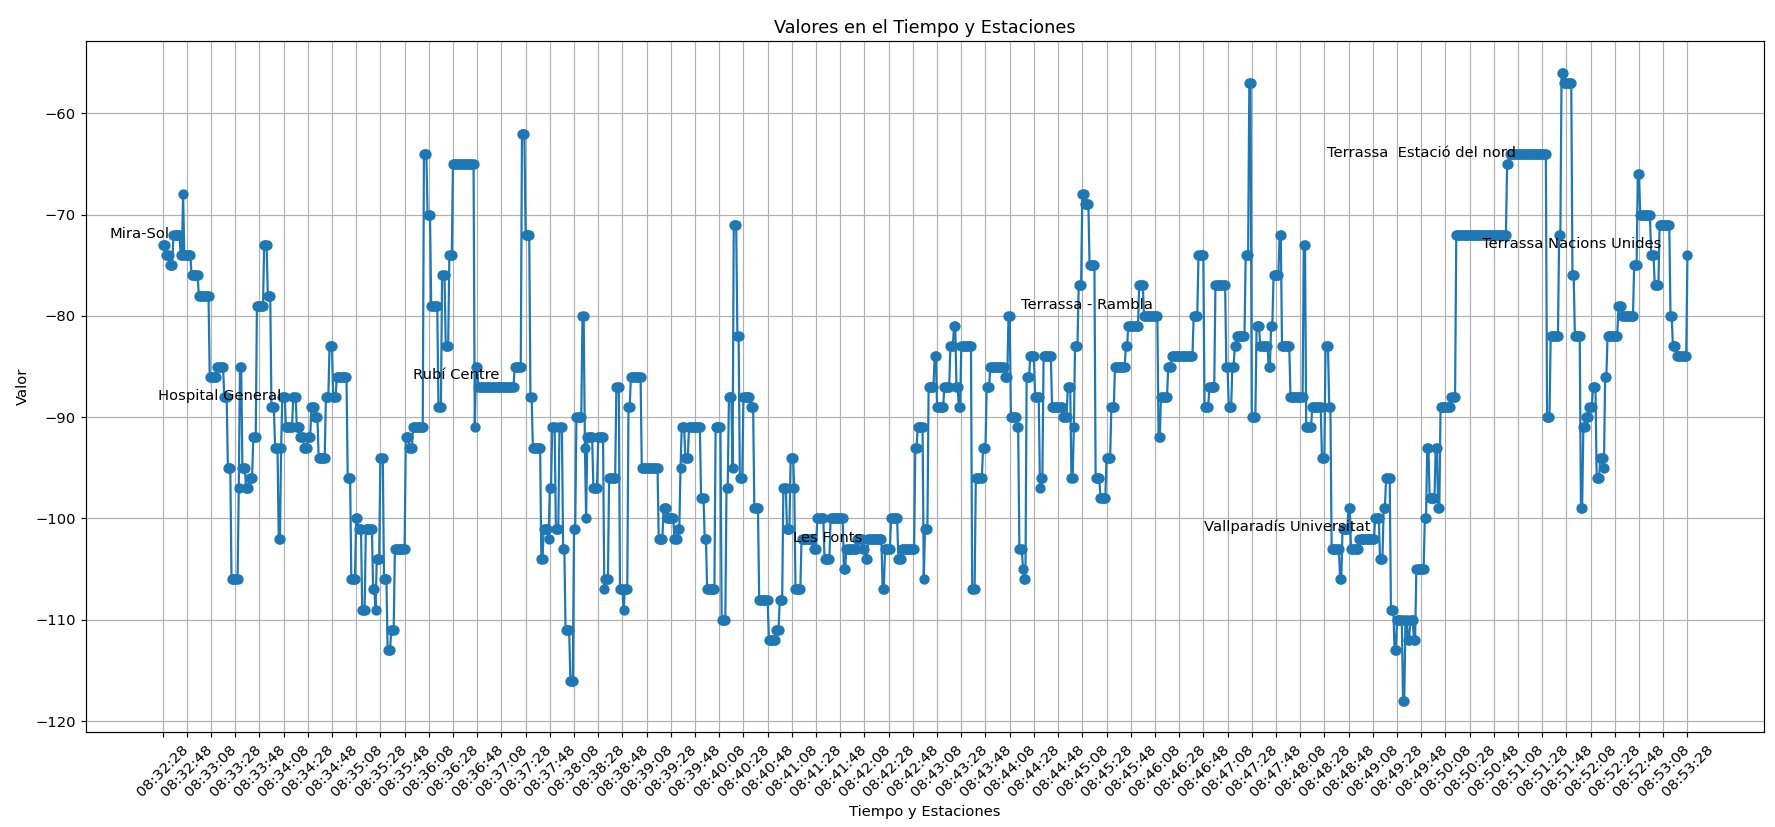
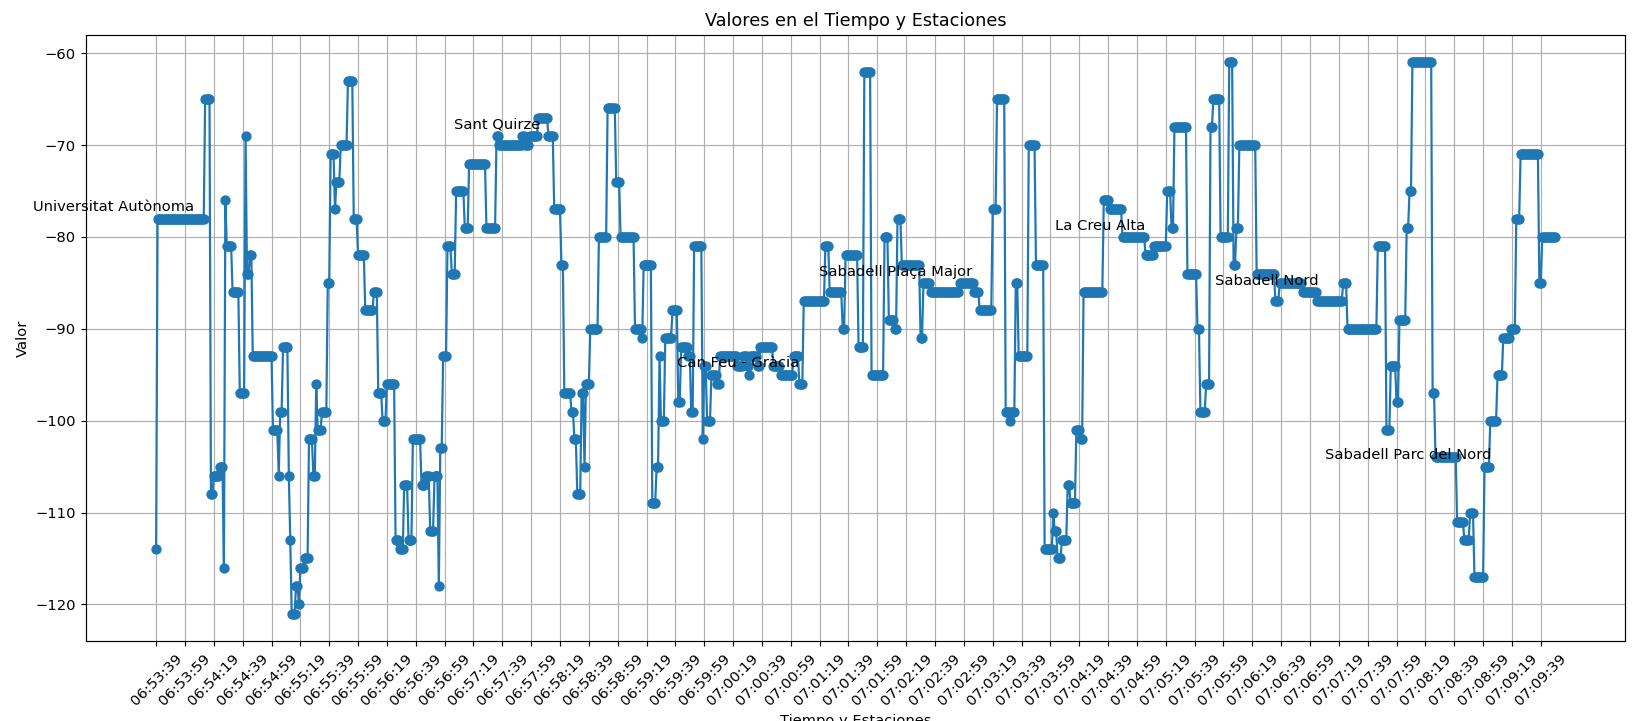
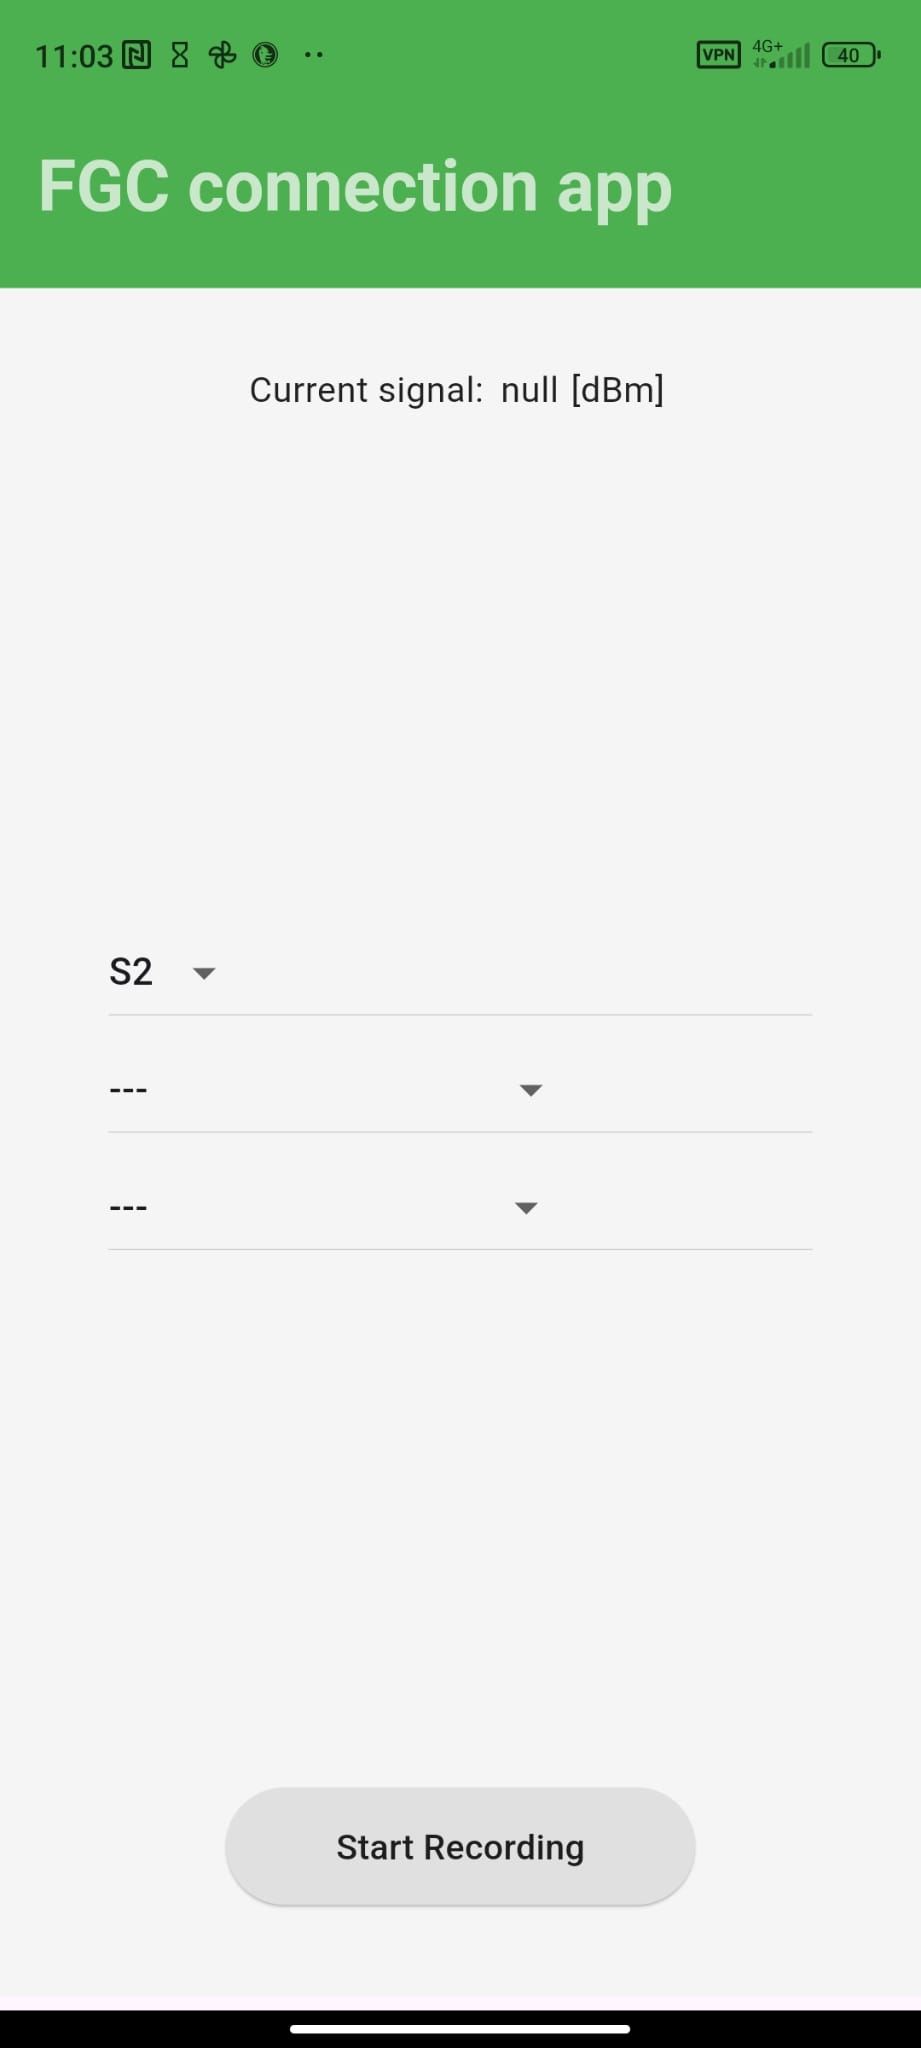
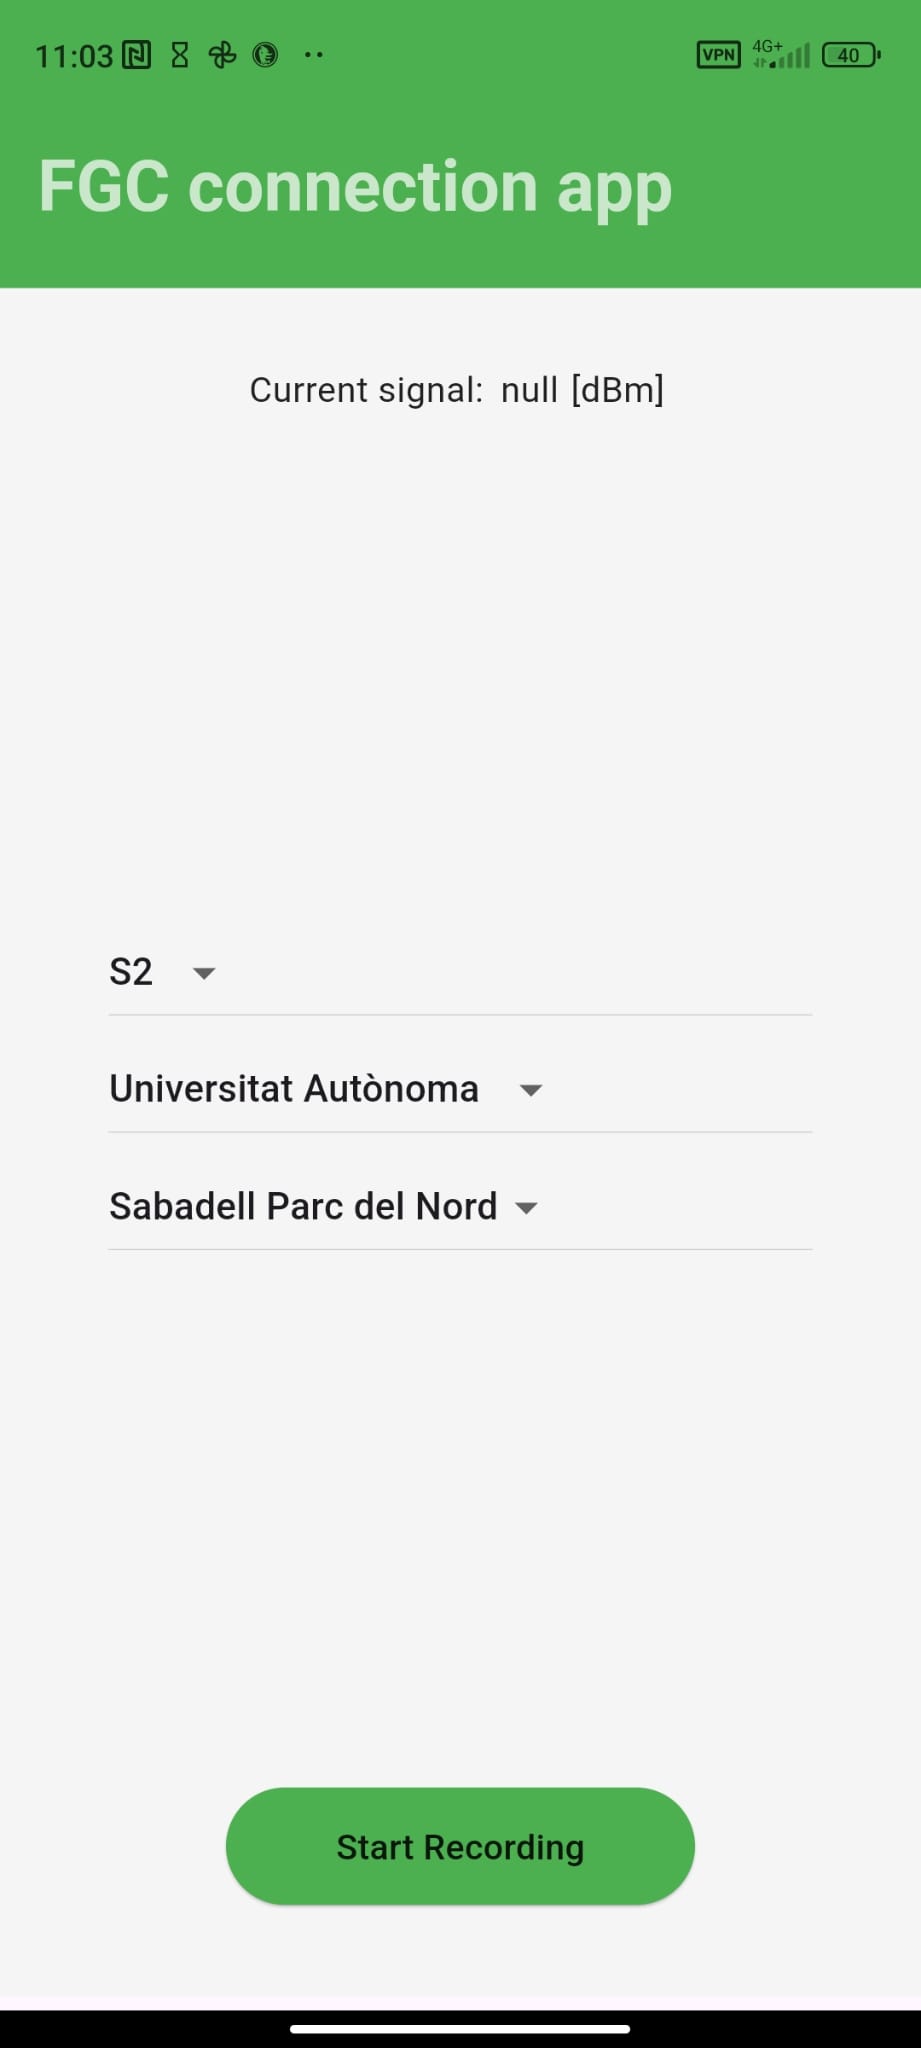
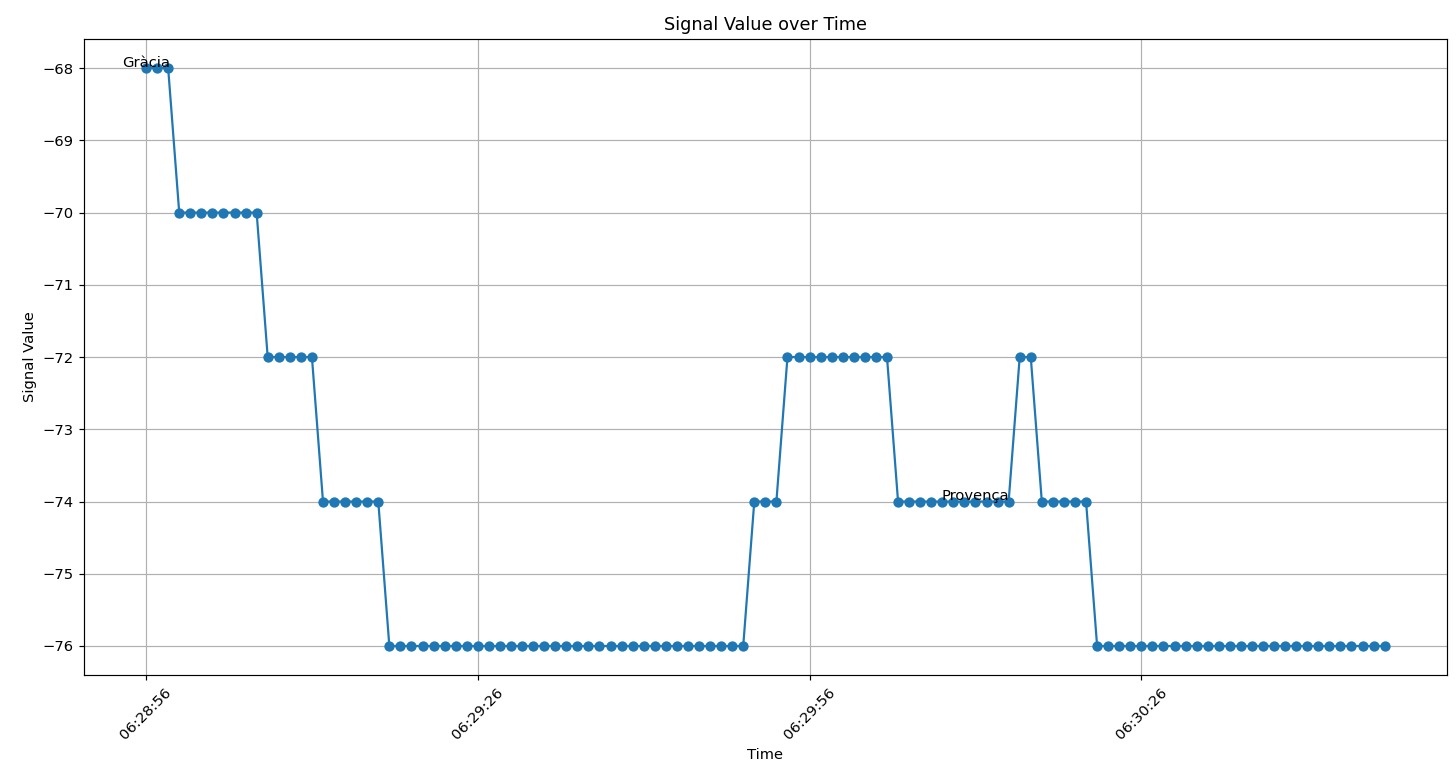
We have created an Android prototype app where we record the signal strength received on the phone. We have stored the data in JSON structures to visualize them with Python plots. Additionally, we have implemented in a small test study to verify the functionalities.
How we built it
We have organized the work into two GitHub repositories. One is dedicated to the app, where we used Flutter and Dart as the programming language. It also locally hosts the static data of the FGC schedules, which we obtained from the GTFS real-time and scheduler API. The data is structured in JSON files, and we visualize the data using a Python script and the plotlib library.
Challenges we ran into
We have encountered complications when merging each other's progress and when using Flutter, as it was the first time for all of us.
Accomplishments that we're proud of
We are proud to have been able to fully implement the idea we had from the beginning without deviating from the main objective.
What we learned
We learned dart lenguage, flutter, jason files and prototyping
What's next for FGC connect
We could continue with the study and accomplish the results and implemtent uppdates

Log in or sign up for Devpost to join the conversation.